Modern network environments require continuous visibility into device state, performance, and protocol behavior. However, traditional polling-based monitoring often fails to scale and rarely provides the level of detail needed for real-time troubleshooting or automation.
In this article, we explore streaming telemetry on Nokia SR Linux devices using gNMI, with Prometheus acting as the time-series data store and Grafana providing visualization. The entire solution is deployed using Containerlab and Docker, which makes the setup easy to reproduce and extend in a lab environment.
We walk through the full telemetry pipeline – from subscribing to gNMI paths on SR Linux devices, through exposing metrics in Prometheus format, to building pre-provisioned Grafana dashboards. The focus is on practical configuration, correctness, and clarity, making this setup a strong foundation for more advanced monitoring and automation use cases.
Environment
Before diving into configuration details, let’s briefly review the environment and tools used throughout this article.
Network Topology
To collect telemetry data, we first need network devices from which the data can be streamed. For this purpose, we reuse a topology introduced in previous articles in this series.
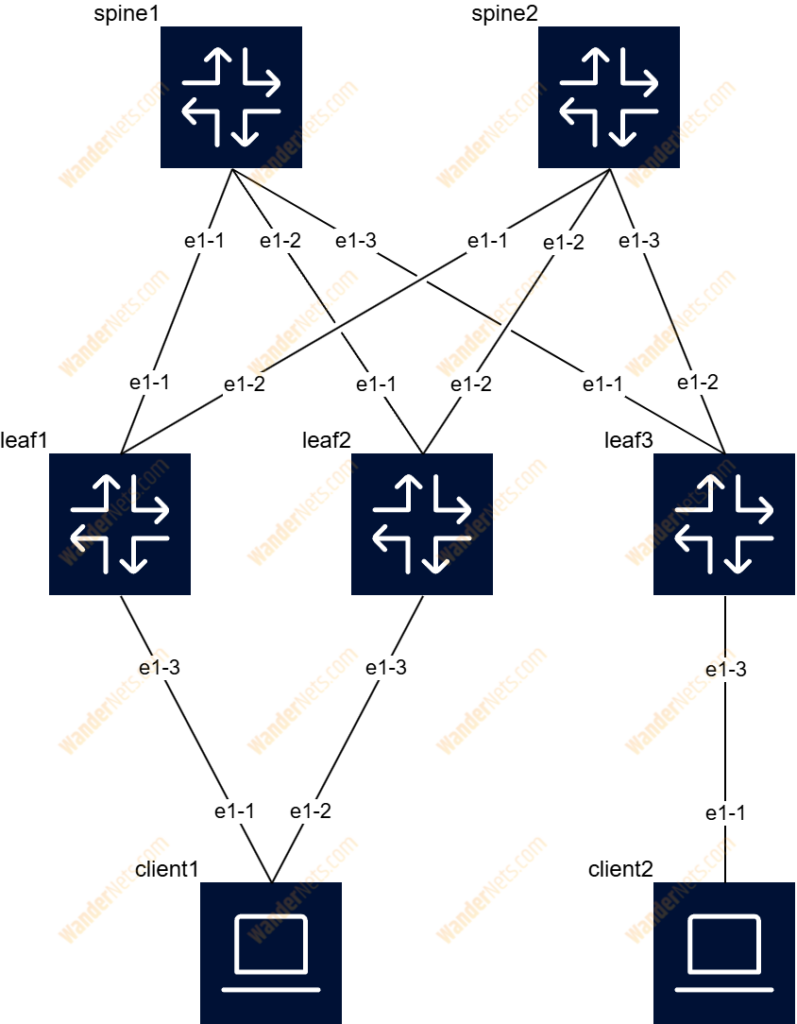
The entire topology is deployed as Docker containers using Containerlab. Detailed instructions on how to deploy it are available in this article, while a full explanation of the topology configuration can be found here.
Telemetry Data Collection with gNMI
There are several methods for collecting telemetry data from SR Linux devices. In this setup, we use the gNMI gRPC interface, which provides an efficient and programmatic way to stream operational data. This makes it a natural choice for automation and observability use cases.
Collecting telemetry data is only part of the problem – the data also needs to be stored and queried efficiently. For this purpose, we use Prometheus, a monitoring system with a built-in time-series database.
To expose gNMI telemetry data in a format that Prometheus can scrape, we could build a custom exporter. However, a much simpler and more robust approach is to use gNMIc. Inspired by this article, we use gNMIc to subscribe to gNMI paths and expose the collected metrics via an HTTP endpoint scraped by Prometheus.
Data Presentation
For data visualization, we use Grafana. Thanks to its flexibility, extensive customisation options, and native Prometheus integration, Grafana fits naturally into this telemetry pipeline.
Services setup
As with the network topology, all telemetry components are deployed as Docker containers.
To manage multiple services, we use Docker Compose, which allows us to describe the full setup declaratively and start all components with a single command. In the following sections, we review each service configuration in detail.
The most up-to-date versions of all code and configuration files used in this article are available in this repository. The Docker Compose file can be found here.
gNMIc
services:
  gnmic:
    image: ghcr.io/openconfig/gnmic:0.42.1
    container_name: gnmic
    ports:
      - "9804:9804"
    volumes:
      - ./configs/gnmic/gnmic.yaml:/app/gnmic.yaml
    command: "subscribe --config /app/gnmic.yaml"
restart: unless-stoppedgNMIc is available as a Docker image, so there is no need to build it manually. The container version is pinned to ensure that the configuration presented in this article remains compatible in the future.
By default, gNMIc listens on port 9804, which we expose outside the container. To run the service, we provide a configuration file mounted at /app/gnmic.yaml and start gNMIc using the subscribe command with that configuration file.
Prometheus
  prometheus:
    image: prom/prometheus:v3.8.0
    container_name: prometheus
    ports:
      - "9090:9090"
    volumes:
      - ./configs/prometheus/prometheus.yaml:/etc/prometheus/prometheus.yml
      - sr-linux-mclag-prometheus:/prometheus
restart: unless-stoppedSimilarly to the gNMIc, the Prometheus container version is fixed. Again, we’re using the default service port – in this case its 9090. Prometheus needs two mounts:
- /etc/prometheus/prometheus.yml – our initial Prometheus config which pre-configures gNMIc as a target.
- /prometheus – used for persistent storage. In this case, we’re not mounting a directory from the hypervisor; instead, we’re using a named volume sr-linux-mclag-prometheus.
Grafana
  grafana:
    image: grafana/grafana-oss:12.2.0-17142428006-ubuntu
    container_name: grafana
    ports:
      - "3000:3000"
    environment:
      - GF_SECURITY_ADMIN_USER=admin
      - GF_SECURITY_ADMIN_PASSWORD=admin
    volumes:
      - ./configs/grafana/datasource_prometheus.yaml:/etc/grafana/provisioning/datasources/prometheus.yaml
      - ./configs/grafana/leaf1_dashboard.yaml:/etc/grafana/provisioning/dashboards/leaf1.yaml
      - ./configs/grafana/leaf1_dashboard.json:/etc/grafana/provisioning/dashboards/leaf1.json
      - sr-linux-mclag-grafana:/var/lib/grafana
restart: unless-stoppedIn the Grafana section, we’re exposing the service on the default port 3000. What’s new here compared to previous containers is the environment section. Here, we’re defining login credentials under GF_SECURITY_ADMIN_USER and GF_SECURITY_ADMIN_PASSWORD variables. Remember to change them before using this instance for any significant work.
The volumes section is also more developed. First three lines are files for pre-configuration of the datasource – Prometheus, and creation of a dashboard with metrics. Last line is mounting a named volume sr-linux-mclag-grafana into /var/lib/grafana to guarantee persistent storage for Grafana.
Named Volumes
To use named volumes, we need to define them in the volumes section.
volumes:
  sr-linux-mclag-prometheus:
    driver: local
  sr-linux-mclag-grafana:
driver: localBy doing so, we’re making sure that they’ll be created during the deployment of the services.
Services Configurations
Besides just spinning up containers with services, we also need to provide the configurations. Let’s review each configuration file for each service.
gNMIc
Configuration of gNMIc consists of 3 sections:
- subscriptions
- outputs
- targets
subscriptions:
  cpu:
    mode: STREAM
    stream-mode: SAMPLE
    encoding: JSON
    sample-interval: 5s
    paths:
    - /platform/control[slot=A]/cpu[index=*]/total/instant
  memory:
    mode: STREAM
    stream-mode: SAMPLE
    encoding: JSON
    sample-interval: 5s
    paths:
    - /platform/control[slot=A]/memory
  interfaces:
    mode: STREAM
    stream-mode: SAMPLE
    encoding: JSON
    sample-interval: 5s
    paths:
    - /interface[name=*]
  bgp:
    mode: STREAM
    stream-mode: SAMPLE
    encoding: JSON
    sample-interval: 5s
    paths:
    - /network-instance[name=*]/protocols/bgp/neighbor[peer-address=*]/afi-safi[afi-safi-name=*]/active-routes
outputs:
  prometheus:
    type: prometheus
    listen: ":9804"

targets:
  leaf1:
    address: clab-sr-linux-mclag-leaf1:57401
    username: admin
    password: NokiaSrl1!
    insecure: true
    subscriptions:
    - cpu
    - memory
    - interfaces
    - bgp
  leaf2:
    address: clab-sr-linux-mclag-leaf2:57401
    username: admin
    password: NokiaSrl1!
    insecure: true
    subscriptions:
    - cpu
    - memory
    - interfaces
    - bgp
  leaf3:
    address: clab-sr-linux-mclag-leaf3:57401
    username: admin
    password: NokiaSrl1!
    insecure: true
    subscriptions:
    - cpu
    - memory
    - interfaces
    - bgp
  spine1:
    address: clab-sr-linux-mclag-spine1:57401
    username: admin
    password: NokiaSrl1!
    insecure: true
    subscriptions:
    - cpu
    - memory
    - interfaces
    - bgp
  spine2:
    address: clab-sr-linux-mclag-spine2:57401
    username: admin
    password: NokiaSrl1!
    insecure: true
    subscriptions:
    - cpu
    - memory
    - interfaces
    - bgp
  client1:
    address: clab-sr-linux-mclag-client1:57401
    username: admin
    password: NokiaSrl1!
    insecure: true
    subscriptions:
    - cpu
    - memory
    - interfaces
  client2:
    address: clab-sr-linux-mclag-client2:57401
    username: admin
    password: NokiaSrl1!
    insecure: true
    subscriptions:
    - cpu
    - memory
    - interfaces
Subscriptions
The subscriptions section defines the gNMI paths from which telemetry data is collected. Each subscription can have its own parameters, such as sampling interval, encoding, and streaming mode.
In this setup, telemetry data is sampled every 5 seconds using gNMI STREAM subscriptions with SAMPLE mode. Each subscription may include one or more gNMI paths, which allows different data types to be grouped logically.
This structure becomes especially useful when different metrics require different sampling intervals or collection parameters.
Outputs
The outputs section defines where collected telemetry data is sent. gNMIc supports multiple output types, such as writing data to a local file or forwarding it to an external system.
In this case, telemetry data is exposed in Prometheus format via an HTTP endpoint, allowing Prometheus to scrape and store the metrics.
Targets
The targets section defines the devices from which telemetry data is collected. For each device, we specify the address and authentication credentials.
The subscriptions field is optional. However, because not all devices in the topology run BGP, we explicitly define which subscriptions apply to each target to avoid unnecessary or failing subscriptions.
Prometheus
Prometheus config is relatively simple and short.
global:
  scrape_interval: 5s

scrape_configs:
- job_name: 'sr-linux-mclag-telemetry'
  static_configs:
  - targets: [ 'gnmic:9804' ]
In the global section, we can define values applicable to all jobs. In our case, we have defined scrape_interval, meaning that Prometheus will pull data every 5 seconds.
In the scrape_configs section, we’re defining collection jobs. Job name is arbitrary. The most important is the target address and port. Since we’re using Docker Compose, which automatically provides name resolution for all of our containers, we can refer to them by name.
Grafana
Grafana configuration is split between several files. What we need to configure is:
- Our datasource – Prometheus
- Dashboard for one of our devices – Leaf1, in this example
To automatically provision our Prometheus as a datasource, we need to insert the configuration yaml file into /etc/grafana/provisioning/datasources/ directory.
apiVersion: 1

datasources:
- name: Prometheus
  type: prometheus
  access: proxy
  url: http://prometheus:9090
  isDefault: true
  editable: true
  jsonData:
    timeInterval: 5s
    httpMethod: GET
The configuration is straightforward. We need to define a datasource type, access, and URL. Again, instead of using plain IP addresses, we’re referring to the Prometheus container with a domain name.
The pre-provisioning dashboard is a bit more complicated. We need to put the dashboard definition in /etc/grafana/provisioning/dashboards/ directory.
First, we need to define a dashboard configuration in yaml file.
apiVersion: 1

providers:
- name: 'Leaf1'
  orgId: 1
  folder: ''
  type: file
  disableDeletion: false
  editable: true
  updateIntervalSeconds: 30
  options:
    path: /etc/grafana/provisioning/dashboards
In the config file, we’re defining basic parameters like the update interval. We’re also pointing to the directory where the JSON file with the dashboard structure is. Since this file is long, it’s not inserted in this article, but you can find it here. If you’re wondering how to prepare such a configuration, don’t worry. It’s autogenerated. You can create a dashboard manually – in the GUI, and save it as a JSON file, which later can be used to pre-provision the exact dashboard.
Result
To spin up all services, navigate to the monitoring directory and run the following command:
radokochman@Hellfire:~/projects/repos/sr-linux-mclag/monitoring$ docker-compose up -d
Creating network "monitoring_default" with the default driver
Creating volume "monitoring_sr-linux-mclag-prometheus" with local driver
Creating volume "monitoring_sr-linux-mclag-grafana" with local driver
Creating gnmic      ... done
Creating prometheus ... done
Creating grafana ... doneLet’s take a look at each service.
gNMIc
You can verify that gNMIc is collecting telemetry data by opening the /metrics endpoint. This page exposes raw Prometheus metrics generated from gNMI subscriptions.

Container hostnames (e.g. gnmic) are resolvable only within the Docker network. From the host machine, use localhost or the Docker host IP.
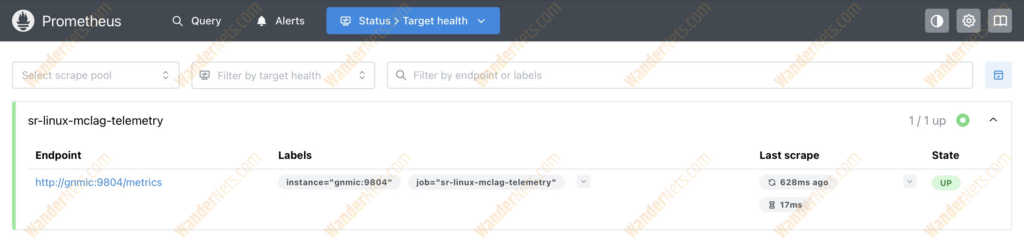
Prometheus
Prometheus is also accessible via web UI under http://localhost:9090/. In Target Health tab, we can check if our target (gNMIc) is present and healthy.
We can also explore metrics provided by gNMIc in the Query section.

We can even query Prometheus for data. Let’s check how many broadcast packets are on the counters on the interfaces on Leaf1. The query to collect data is as follows:
interface_statistics_in_broadcast_packets{source="leaf1"}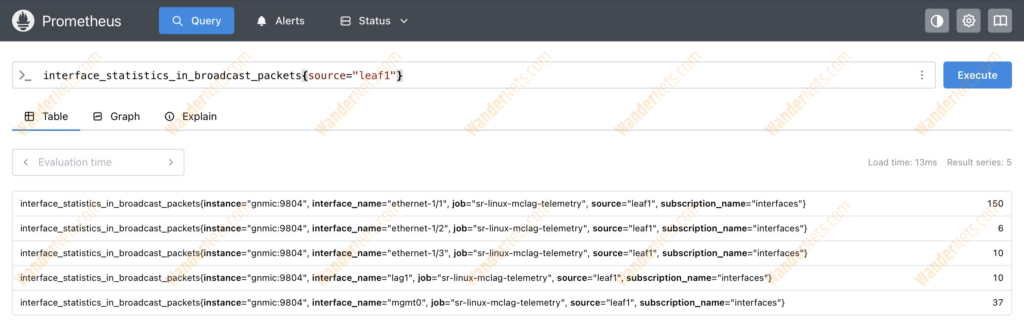
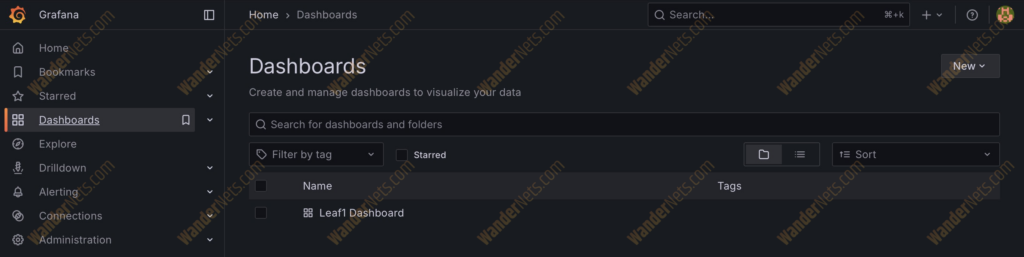
Grafana
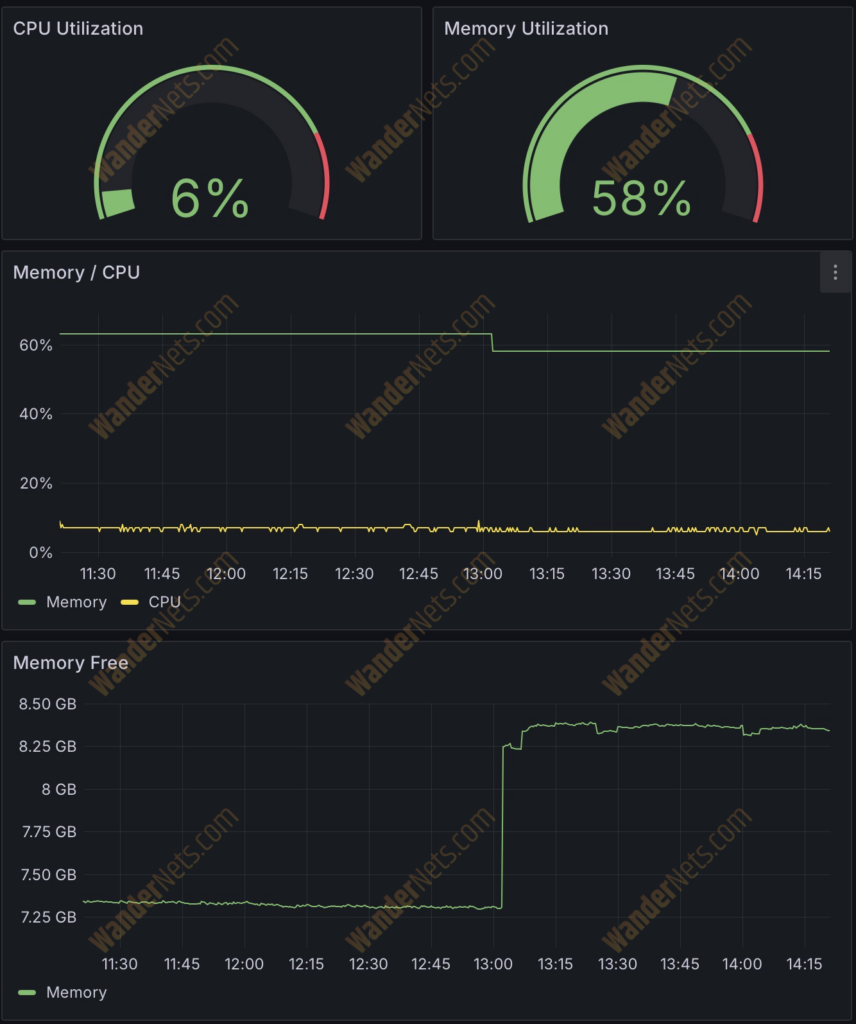
To access Grafana, go to http://localhost:3000/. In the Dashboards section, you’ll see the Leaf1 Dashboard. It’s already pre-provisioned with charts showing different metrics.
There are way more metrics stored on Prometheus that can be used here. We decided to pick a few to show the effect.
Here are charts showing CPU and memory utilization.
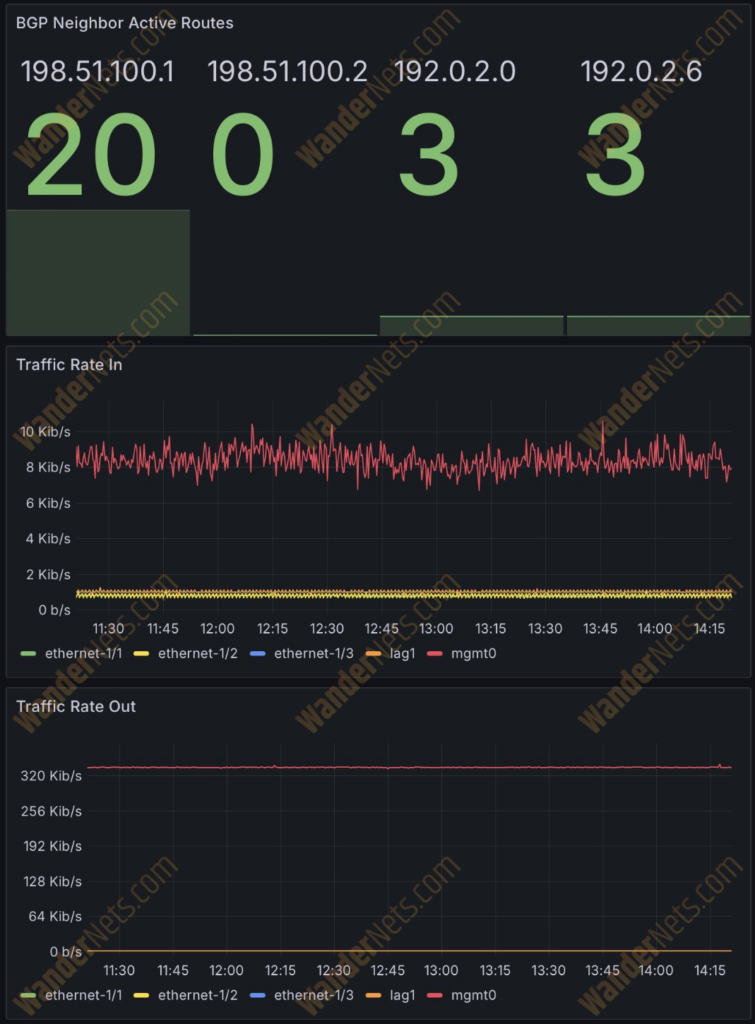
There is also a bar chart showing the number of active BGP routes from different neighbors. Also, below are charts with the traffic rate (in/out) for all configured interfaces.
There are also charts showing interface packet errors and frame CRC errors.

Troubleshooting
Issues can occur in any environment, so this section outlines a few recommended troubleshooting steps to help diagnose common problems.
Network Topology Problems
First of all, there is an easy way to test the network topology deployed by Containerlab. You can run automatic smoke tests written in Python. The detailed instruction how to do so are here.
Data Collection Problems
If you’re accessing gNMIc (http://localhost:9804/metrics), but instead of metrics, you see just a blank, white page. Make sure that your Containerlab topology is deployed and operating correctly. If so, make sure that gNMIc has connectivity via domain names to network containers. You can also try to update Containerlab – this worked in our case when we encountered such problems.
Summary
In this article, we built a complete telemetry pipeline for SR Linux devices, using gNMI streaming subscriptions to collect operational data, Prometheus to store metrics, and Grafana to visualize them. By deploying all components with Containerlab and Docker, the solution remains lightweight, reproducible, and easy to extend.
This approach highlights how modern streaming telemetry differs from traditional polling-based monitoring and why it is better suited for scalable network environments. While the lab setup focuses on a limited set of metrics and devices, the same architecture can easily be expanded with additional telemetry paths, dashboards, and integrations.
Overall, this setup provides a solid foundation for further exploration of network observability, testing, and closed-loop automation using SR Linux and open-source tooling.
Authors